Spectrophotometer
Designed and built a low-cost spectrophotometer for measuring the absorbance of liquid samples. The device combines an LED light source, a CdS photocell, an analog signal-filtering circuit, an Arduino Uno R3, a live MATLAB interface, and a custom 3D-printed enclosure.
The design was developed iteratively through prototyping and testing, with the final system calibrated against a laboratory spectrophotometer.
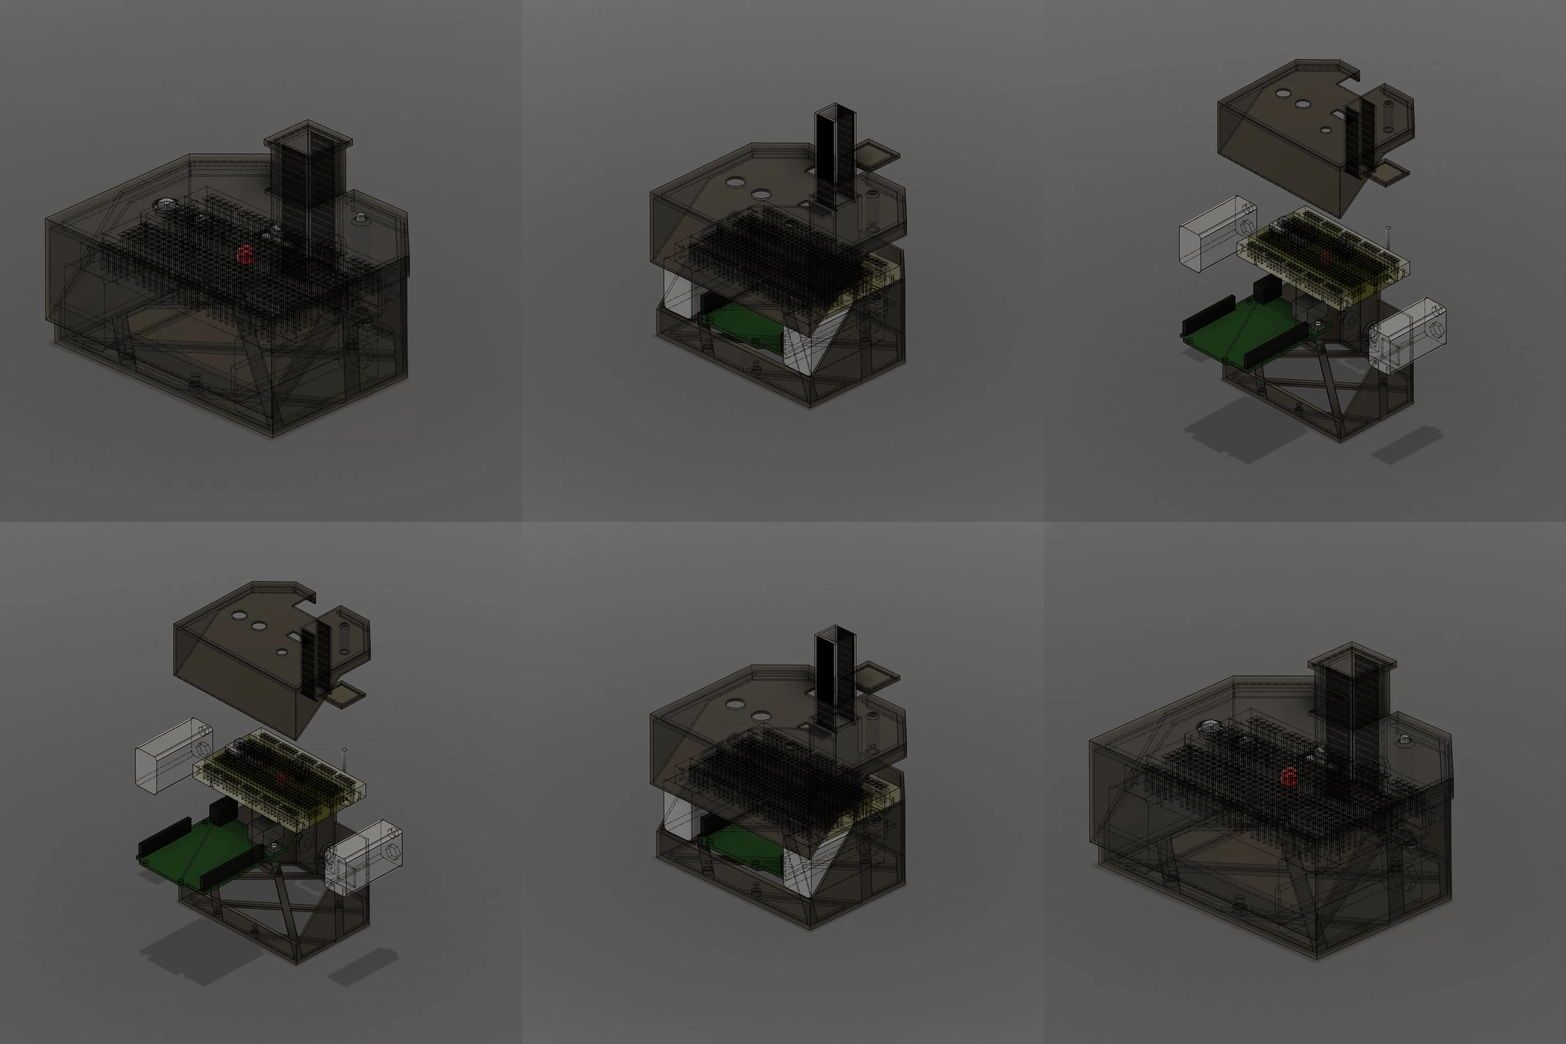
Design
The optical system passes light from a blue LED through a cuvette and measures the transmitted light using a 7 mm VT83 CdS photocell. The photocell output is filtered using a voltage divider and non-inverting amplifier before being measured by an Arduino Uno R3.
The final design incorporated several improvements identified through prototype testing:
- Replaced the original 5 mm CdS photocell with a larger VT83 detector
- Tuned the amplifier to prevent signal saturation
- Added Arduino-based data acquisition
- Added physical controls for zeroing and starting/stopping tests
- Improved LED and detector alignment
- Enclosed the optical path to reduce ambient light interference
- Redesigned the enclosure to integrate the electronics, Arduino, batteries, and cuvette in a space efficient manner
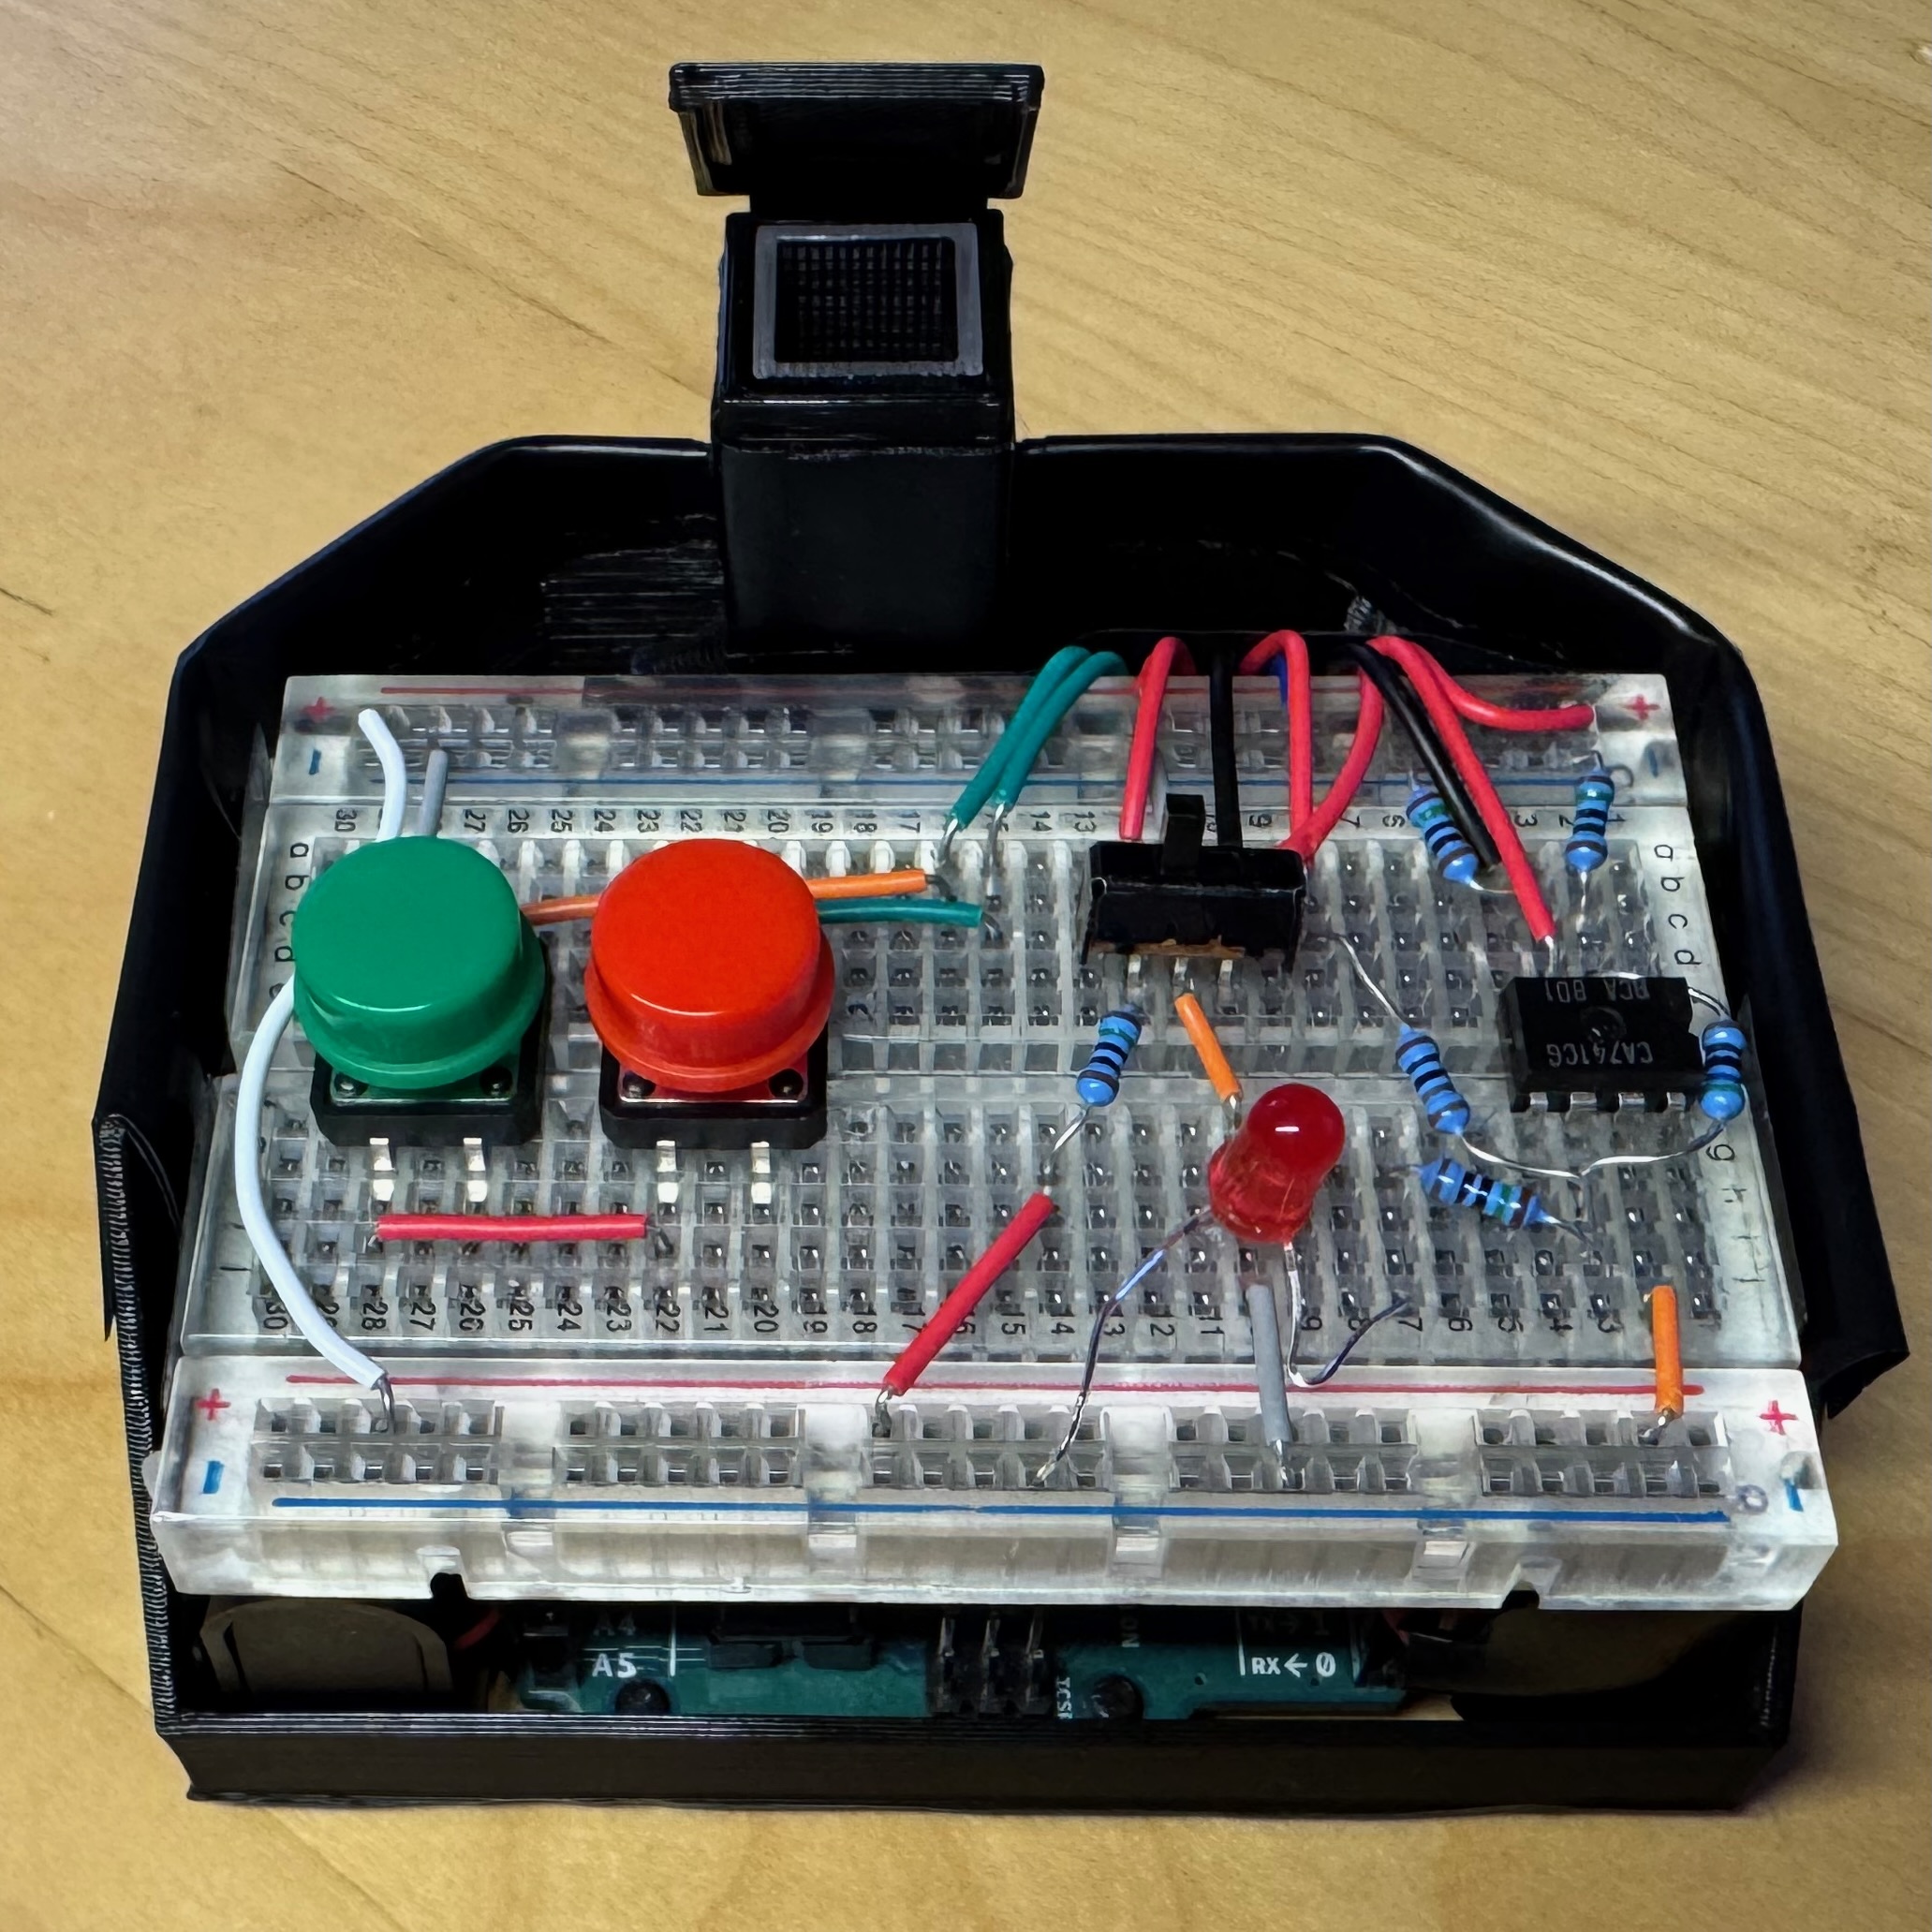
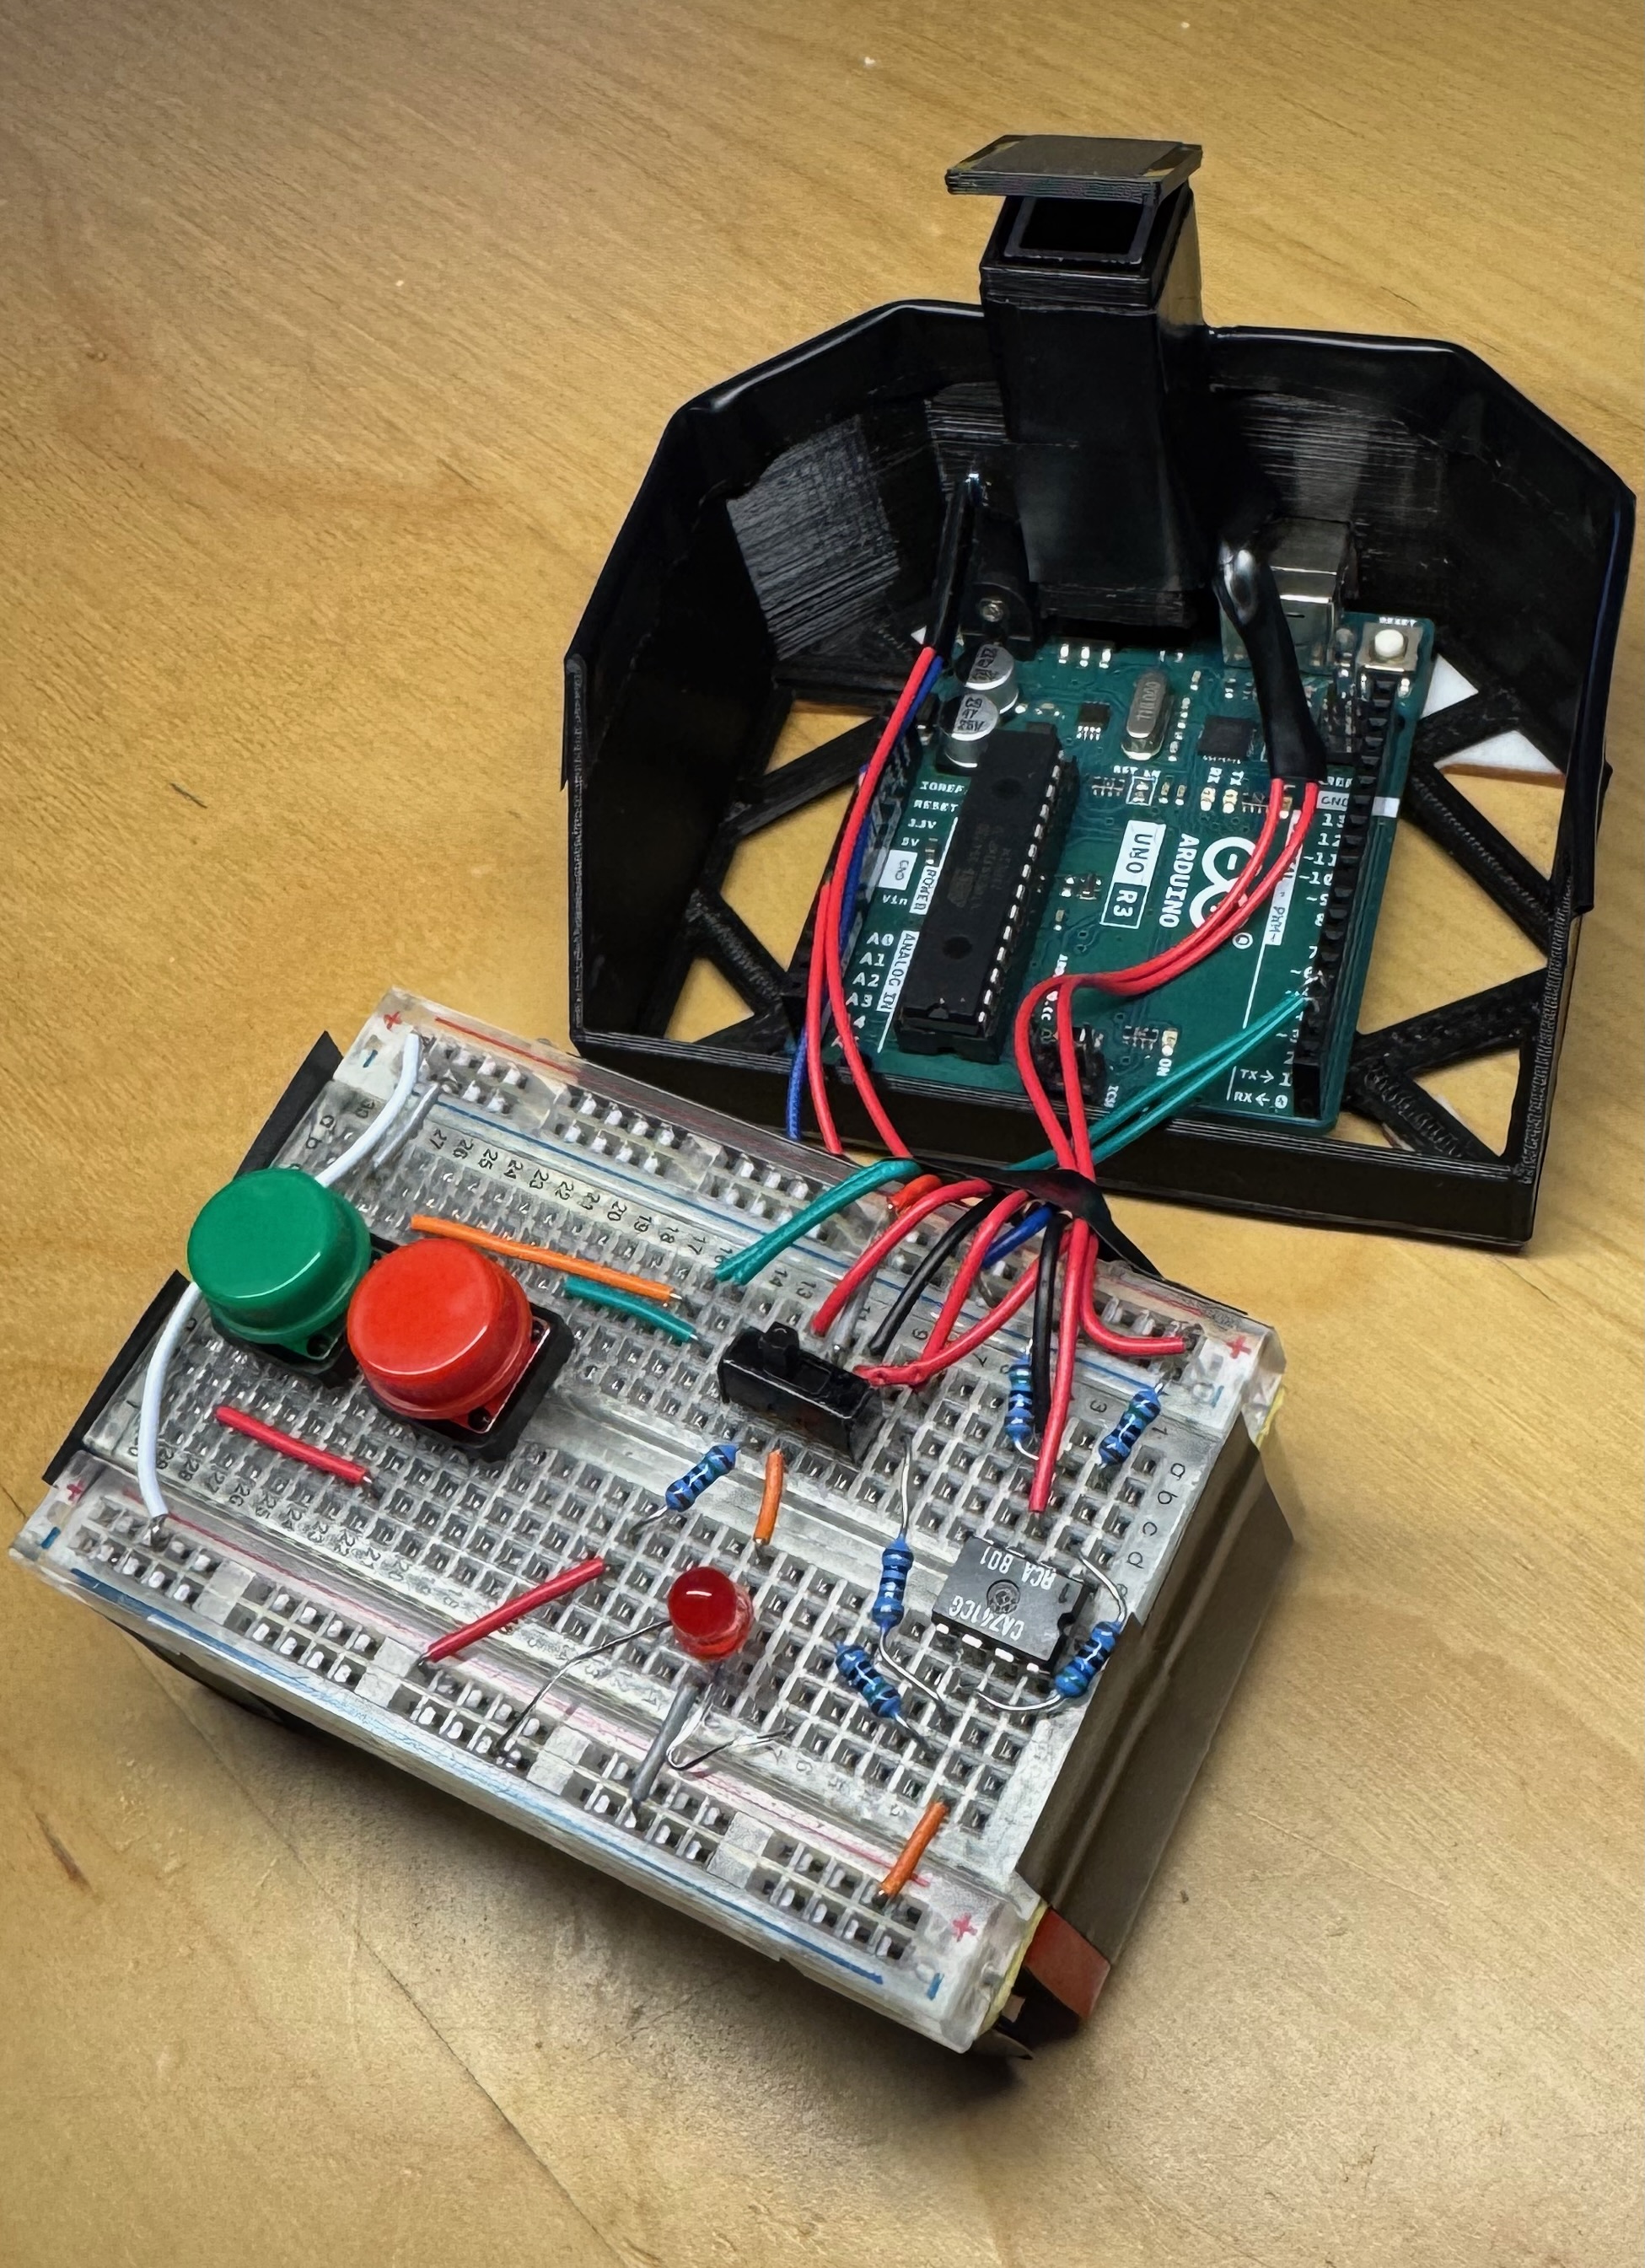
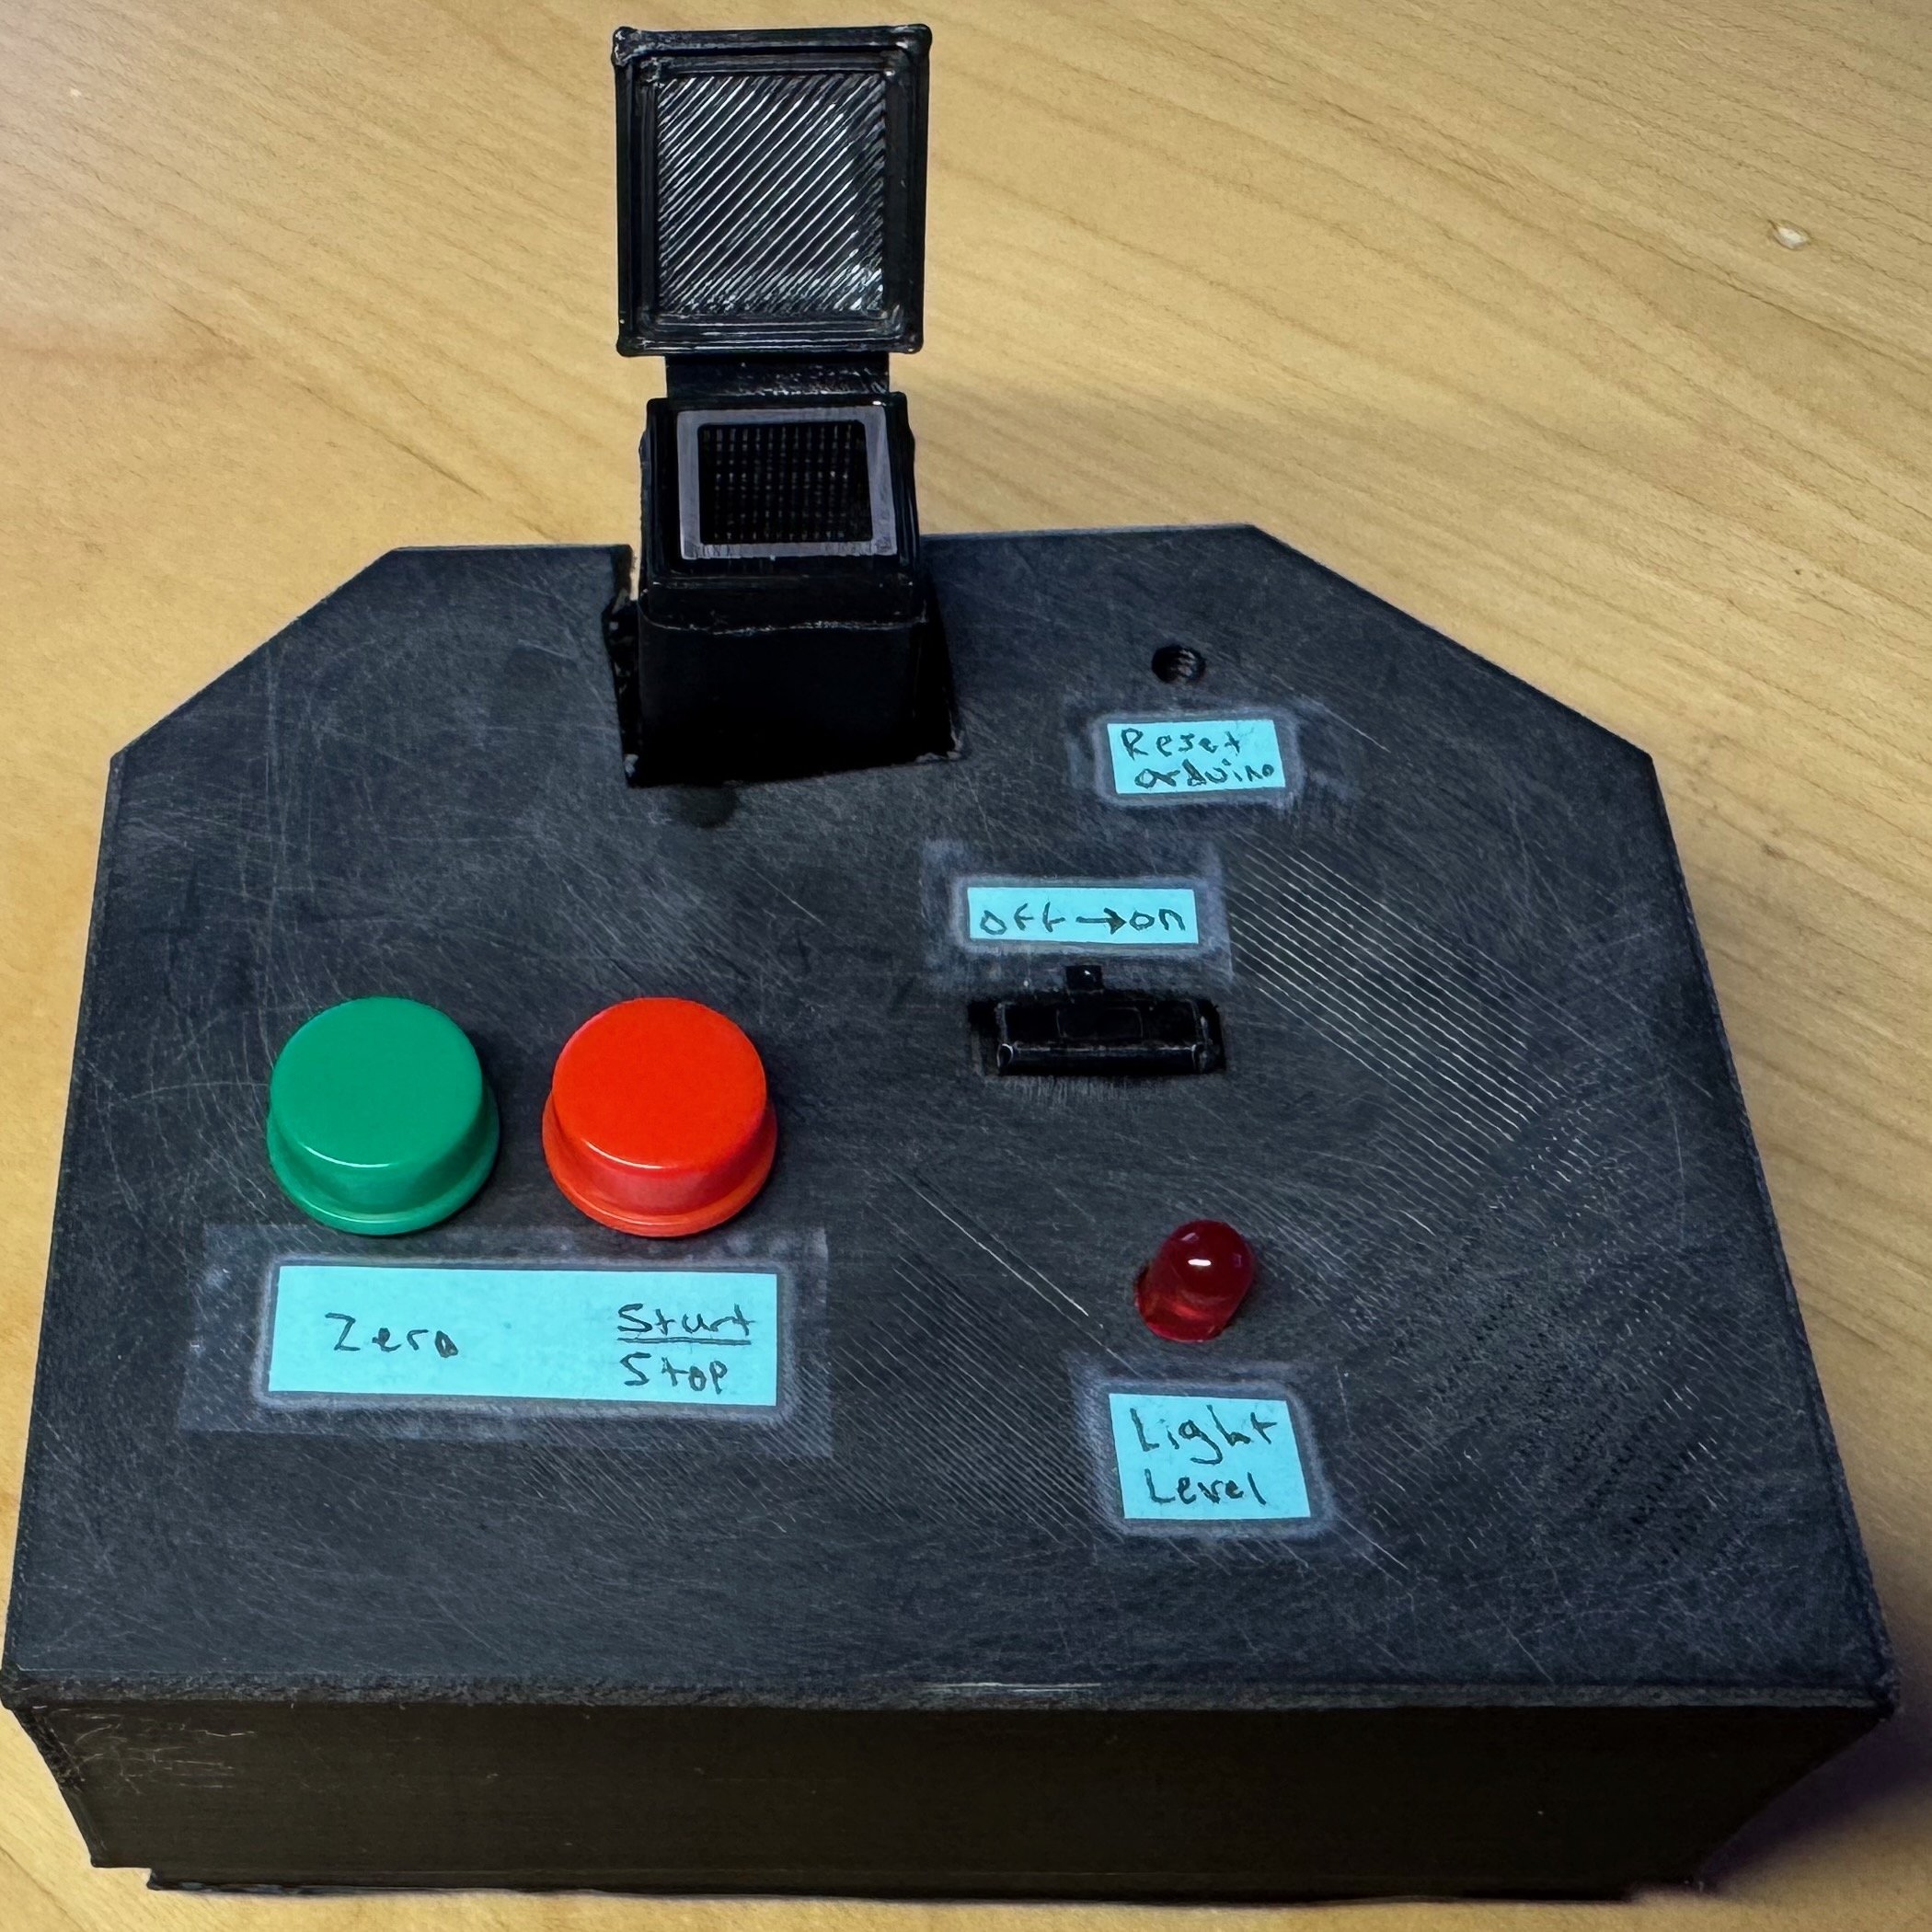
Software
The Arduino's firmware continuously samples the analog detector output and sends time, voltage, and button state data to a MATLAB terminal over USB.
A MATLAB script handles the measurement workflow, including:
- Zeroing the device against a baseline sample
- Starting and stopping measurement trials
- Live plotting of voltage and absorbance
- Converting measured voltage to estimated absorbance
- Calculating average measurements for each trial
The MATLAB program uses WAIT, ZERO, and RUN states to control the testing process.
Calibration & Results
The device was calibrated using a series of Tartrazine dye concentrations. Measurements from the constructed spectrophotometer were compared against absorbance measurements from a laboratory spectrophotometer.
MATLAB was used to fit a nonlinear voltage-to-absorbance relationship to the reference measurements. The final calibration curve produced an R² of 0.9979, showing a strong relationship between the constructed device and the laboratory reference.
Tools & Technologies Used
- Arduino Uno R3
- Arduino / C++
- MATLAB
- KiCad
- Fusion 360
- Analog circuit design
- Serial data acquisition
- Curve fitting and calibration
- 3D printing